Rate Limits & Plans
Chartmetric meters every API plan on a requests-per-second (req/sec) basis using a sliding window algorithm. Different plans get different limits. Your limit is reported on every response — read the headers and pace accordingly.
Sliding Window vs Fixed Window
The sliding window is not broken into fixed clock-aligned periods. It starts from when the first request in the window is received and slides forward request-by-request.
Example — plan allows 2 req/sec:
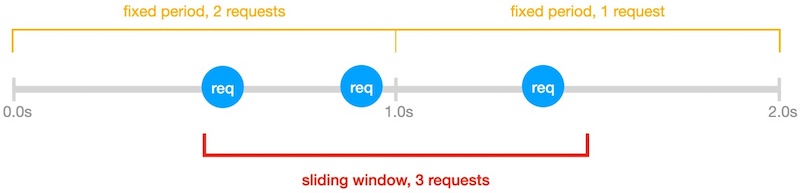
- A fixed-window view would see two 1-second buckets: 2 requests in the first, 1 in the second — both under the limit.
- The sliding window starts at the first request. Within that 1-second slide, 3 requests arrive, exceeding the 2 req/sec cap. The third request is rate-limited.
Takeaway: spacing requests evenly is more reliable than batching them at the start of a clock second.
Response Headers
Every API response carries the current rate-limit state. Use these instead of guessing.
| Header | Description |
|---|---|
X-RateLimit-Limit |
Requests allowed per rate-limit window (usually 1 second). Constant for your plan; only changes when you change subscription. |
X-RateLimit-Remaining |
Requests left in the current window: Limit − (requests received in the last window). Computed at the moment the request is received — not against fixed clock buckets. |
X-RateLimit-Reset |
Unix epoch time of the earliest moment a new request would succeed: (timestamp of oldest request in the last window) + (window duration). |
When you hit 429 Too Many Requests, sleep until X-RateLimit-Reset before retrying.
import time
from requests import get

res = get(url, headers={'Authorization': f'Bearer {token}'})
if res.status_code == 429:
    wait = int(res.headers['X-RateLimit-Reset']) - int(time.time())
    time.sleep(max(wait, 1))
    res = get(url, headers={'Authorization': f'Bearer {token}'})
Throughput
The limit counts requests received, not requests completed. Endpoints differ in compute cost — some return in <100ms, others take seconds. Throughput in practice depends on both your req/sec ceiling and the latency of the endpoints you call.
Worked example — plan: 25 req/sec, 100 serial requests:
- All 100 requests complete in <1 second each → effective throughput ≈ 25 req/sec, all responses received.
- 80 complete in <1s, 20 are computationally heavy and take ~2s → effective throughput ≈ 20 req/sec.
Tips:
- Parallel requests get responses faster but hit the rate limit sooner. Use a bounded concurrency pool.
- A constant request cadence maximizes effective throughput. Bursting wastes the window.
- For batch jobs, gate concurrency on
X-RateLimit-Remainingrather than a fixed worker count.
Plans
Each subscription tier has its own req/sec ceiling. To see your current limit, read X-RateLimit-Limit from any response.
For pricing and to upgrade your plan, contact hi@chartmetric.com.
Handling 429
When a request exceeds your rate limit:
- Status:
429 Too Many Requests - Headers still report
X-RateLimit-Reset
Recommended retry strategy:
- Read
X-RateLimit-Reset. - Sleep until that timestamp (with a small safety buffer).
- Retry the request.
- On repeated
429s, add exponential backoff and reduce concurrency.
Do not tight-loop retry — it burns your budget against the same window.
See Also
- Authentication — token flow and
401handling. - API Reference — per-endpoint parameters and try-it console.